Recently, we see a special emphasis has been laid on software supply chain security referring to the recent report by Google – 2022 Accelerate State of DevOps Report. With security holding center stage, we see a good emergence of practices such as “SRE” and “DevSecOps.”
Looking at the State of DevOps report from different companies such as Google, CircleCI, Puppet, and Dynatrace we have got some common findings such as –
- continued difficulty with delivering timely business value and innovation
- a fragmented toolchain
- quality sacrifices
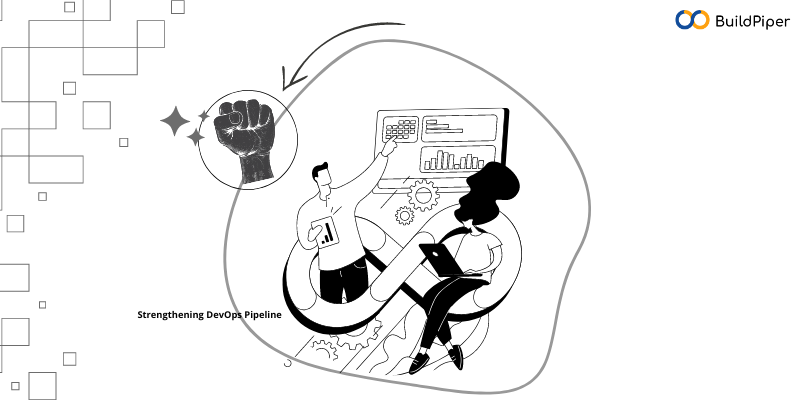
To get more clarity behind these similar findings, let’s understand what makes a DevOps pipeline. How can we strengthen our DevOps pipeline?
Before our discussion begins, organizations that want to adopt DevOps should remember
- what DevOps is
- what DevOps does
- what goals to set for successful DevOps adoption.
Why Does DevOps Matter?
Today software is no longer a mere support for business but has become an integral component of every part of a business. Just the way companies have sped up the production of physical goods with industrial automation, similarly, we now need to transform how the build and delivery of software can get better.
The goal of DevOps is to increase the velocity of software delivery whilst maintaining the stability and availability of your applications. To achieve this it has two core principles –
a) Elimination of siloes among cross-functional teams
b) Bringing in Automation
What makes DevOps
First, let’s understand what DevOps is in action with some instances
- With microservices and continuous delivery, teams take ownership of services and then release their updates/patches quicker.
- Monitoring and logging practices help all teams stay informed of any deviations in performance in real-time.
This brings both the dev and ops teams together breaking down siloes.
DevOps is incomplete without automation. We need DevOps Automation to reduce human assistance, and also reduced errors. This also facilitates feedback loops between dev and ops teams so that iterative updates can be deployed faster to applications in production.
Now, what we are looking for is that one practice, approach, or tool that brings all of this together with automation.
It is the Continuous Integration and Continuous Delivery (CI/CD) Pipeline. Through the CI/CD pipeline is how we omit the barriers and the transition between dev-centric domains and ops-centric domains happens.
CI/CD pipeline has become the backbone of DevOps. It brings in DevOps automation in the form of automated tests and automated deployments.
Code from a faulty CI/CD pipeline deployed in production maximizes the potential for incidents and disruptions, and given its fault, it could have missed capturing any error.
A failed CI/CD stage affects both velocity and stability in the DevOps pipeline.
This automatically makes the CI/CD phase fragile. One such commonly noted event is “flaky tests” by developers. The condition where certain automated tests in CI may randomly fail or succeed without any actual change in the code.
Differentiating the “CI” part of the CI/CD pipeline
Continuous integration consists of the version control system, automated code building, and automated testing. It becomes the single source of truth by providing a version control system and artifact repository. The prime motive of continuous integration is to ensure the changes in the code are continuously integrated and appropriately tested.
(A good read – Elements of CI/CD Pipeline)

To keep up with the rapid development pace, developers tend to override these tests, ignoring all the warning signs. This actually creates vulnerable gaps in our deployed codes which obviously maximizes the chances of getting our environments corrupted.
Ultimately downgrading our trust in CI processes.
How to strengthen the DevOps Pipeline?
The objective of the DevOps environment is to avoid the slippery slope of unknown fails. Considering the importance of the CI phase, we need to take appropriate measures to strengthen it.
Furthermore, with an increased preference for cloud microservices, it has become seemingly difficult to debug CI tests in a distributed environment. Many of these issues have arisen due to the erosion of observability, caused by the abstraction of the underlying layers of infrastructure when using the cloud.
Although on the surface the usage of microservices toolchain doesn’t demand any adoption of new social practices. Yet, normally seen, it’s too late before the tech teams realize their old work habits not helping them address the management costs introduced by this new technology. This makes it essential to understand why the successful adoption of cloud-native design patterns needs robust observable systems and the best DevOps and SRE practices.
The Role of Observability in Strengthening the DevSecOps Pipeline
The goal of observability is to enable people to reason about their internal state of systems and applications by providing a level of self-examination.
For example, we can employ a combination of logs, metrics, and traces as debugging signals.
However, if we look at the goal of observability we find it agnostic in terms of how it can be accomplished.
Looking back at monolithic systems, it was easier to anticipate the potential areas of failure and thereby making it easier to debug the entire system all by ourselves. Also, in addition to that, we were easily able to achieve the appropriate observability by using verbose application logging, or coarse system-level metrics such as CPU utilization combined with additional insights. Yet, these tools and techniques no longer work for the new management challenges created by cloud-native systems.
If we draw a comparison between legacy technologies like virtual machines and monolithic architectures and present-day technology like containerized microservices – we might find it difficult to get data with old observability tactics.
This is because –
- Growing complexity from interdependencies between components
- Transient state discarded after container restart
- Incompatible versioning between separately released components
For debugging anomalous issues, engineers need help to detect and understand issues from within their system, i.e., a new set of capabilities. Distributed tracing can help in capturing the state of system internals when specific events occur. It can be done by adding some context in form of many key-value pairs to each event – making it easier to capture all parts of our system. Quite helpful in breaking down and visualizing each individual step. As it shows the impact of the components while executing a specific request due to their interdependency.
The paradigm shift from cause-based monitoring toward symptom-based monitoring means that we need the ability to explain the failures we see in practice, instead of enumerating a growing list of known ways of failures.
How can Observability Empower the DevSecOps Pipeline?
Chaos Engineering and Continuous Verification
To detect the normal state of the system and how it deviates from it when some fault is introduced. The point to note is to understand your system’s baseline state to explain deviations from expected behavior.
Feature Flagging
A feature flag is a software development process for remotely enabling or disabling functionality without deploying code. Here new features are deployed without making them visible to users. This is preferred when certain codes cannot be tested exhaustively in pre-prod environments. They’re required to be deployed in production to observe their collective impact.
Progressive Release Patterns
Deployment strategies like Canary and Blue/Green deployment employ better precision in observability to learn when to stop the release and analyze any deviations if caused.
Incident Analysis and Blameless Postmortem
It’s a very useful report that not only describes the technical fault but also supplements it with what the human operators thought the fault/error to be. It facilitates the construction of clear models of your sociotechnical systems.
Conclusion
As DevOps and SRE practices continue to evolve, and with platform engineering growing as an umbrella discipline, it appears quite obvious that the future in tech looks more promising with innovative engineering practices emerging in our toolchains. However, all of this depends on having a better observability model as a core component to understanding modern complex systems.
DevOps teams struggling to get clear visibility of their applications can rely on BuildPiper – as an underlying DevSecOps Platform for gaining complete Observability & Monitoring!
It allows seamless integration and set-up of infrastructure monitoring tools such as Prometheus, Grafana, Alert Manager, and log management tools like ElasticSearch, Fluentd, and Kibana. Empowering the DevOps teams in gathering granular information about the performance of containerized applications. And helps them continuously assess and enhance the application’s reliability.

