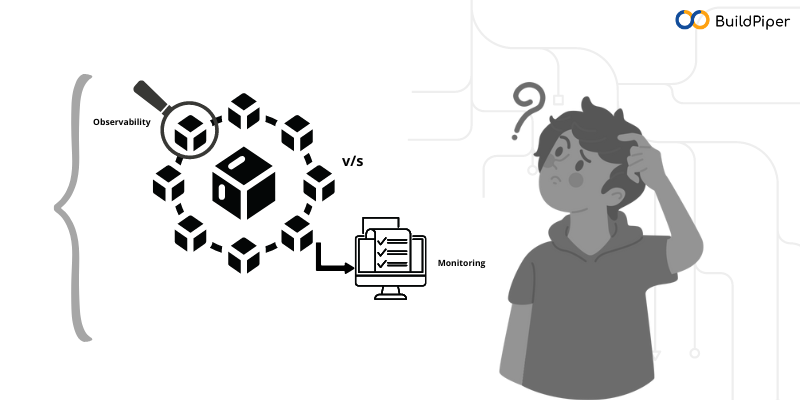
Monitoring alerts IT teams when something is wrong, while observability can tell what the actual problem is, why it occurred and how can your team fix it. To better understand the difference between monitoring and observability, let’s read in detail about these and the roles they play today within software development.
Also read about:
The 3 Pillars of Observability: Logs, Metrics and Traces
Challenges of Monitoring Microservices
Let’s Begin!
With microservices architecture becoming the de facto standard for web applications, monitoring plays an important part in identifying bugs and errors. Effective debugging and diagnosis require that the system should be observable — that is, its internal state can be inferred by observing its output.
However, there is a very thin line between observability and monitoring and most software teams do not know the difference. In this blog, we’ll discuss monitoring, observability, and the difference between the two. So, let’s read in detail about Observability vs Monitoring here!
What is Observability?
Wondering what is observability in SRE. So, here you go! Observability allows DevOps & SRE teams to understand a complex internal state of a system based on external outputs. When a system is observable, a user can identify the root cause of a performance problem simply by looking at the data it produces without additional testing or coding.
An observability solution analyzes the output data and provides a realistic assessment of the system’s health and functioning, offering actionable insights to address the actual problem. In other words, observability allows teams to identify problems proactively and resolve issues faster.
Observability measures how well teams can comprehend a system’s internal states from its external outputs. Observability provides insights into the system performance and helps in identifying bugs and issues if there are any. It helps you get solutions to questions like,
- What requests are being executed by the services?
- What and where are the performance bottlenecks?
- How was the execution of the request different from the expected system behaviour?
- Why did the request fail?
- How did each microservice process the request?
Hope, you now have a clear idea of what is observability in SRE.
[Good Read: Observability For Monitoring Microservices — Top 5 Ways!]
What is Monitoring?
Monitoring is the process of assessing the health of a system by collecting and analyzing aggregate data from IT systems based on a predefined set of metrics and logs. In DevOps, the process of monitoring gauges the health of the application. For instance, creating a rule that sends a notification when the app is approaching 100% disk usage, helps in preventing downtime.
Monitoring is really beneficial in analyzing long-term trends and alerting. It lets the DevOps teams know how the app is functioning, get deep insights into the system’s performance and identify failures.
However, monitoring has certain limitations. For monitoring to produce the desired results, you have to know what metrics and logs to track. If your team fails to predict a problem, it can miss critical production failures and other issues. Let’s dive into this interesting discussion on Observability vs Microservices!
The Difference Between Monitoring and Observability!
Both Observability and Monitoring complement each other, with each one serving a different purpose. Here’s how one is different from the other. Let’s take a look at this discussion on Observability vs Monitoring!
What do they Convey? Monitoring informs you when something is wrong, while observability enables you to understand why the problem occurred. Monitoring is a subset of and key action for the process of observability. Teams can only monitor a system that’s observable.
What do they Track? Monitoring tracks the complete health of an app. It collects all data on how the system is performing in terms of access speeds, connectivity, downtime, and bottlenecks. Observability, on the other hand, drills down into the “what” and “why” of application operations, by providing detailed insights into its specific failure zones.
What do they Enable? While monitoring practices provide teams with solutions only for known problems or occurrences, software instrumented for observability allows developers to ask questions in order to resolve a problem or gain insight into the all-around state of the system affected by issues.
I am sure, after reading this blog, you now have a better understanding of the difference between Monitoring and Observability.
BuildPiper- The Perfect Observability & Monitoring Platform for Your Team!
With BuildPiper, your DevOps team becomes equipped with an end-to-end Kubernetes & Microservices Application Delivery Platform that enables more than 10X reduced time & investments required to onboard & securely manage Kubernetes & Microservices application setup and deployments along with the ability to run zero-touch, fully-automated & secured CI/CD pipelines.
BuildPiper empowers your DevOps team with a single standardized platform without any vendor lock-ins or tooling bursts and with complete support for microservices observability, cluster monitoring, easy customization and manageability. Here’s how it can help your team in gaining complete Microservices observability and insights of cluster nodes & pods via the Kubernetes dashboard.
Observability!
BuildPiper provides,
- Clear visibility of all the activity steps during the build operation.
- Viewing detailed logs of the build operations.
- Complete visibility of the deployment status with in-depth reporting on the reasons for failure.
- A comprehensive overview of pod events, conditions related to pods, the number of pods running, and the complete health status of the pods, for finding issues during service deployment and reasons for failure.
- A Service Overview Dashboard that allows DevOps teams to view and monitor the build and deploy details.
- A Service Kubernetes Dashboard that provides out-of-the-box microservice and cluster observability capabilities allowing users to view and monitor the performance, health status, CPU and memory allocation, node availability, logs, and other important metrics.
Monitoring!
BuildPiper enables seamless integration and set-up of
- Infrastructure monitoring tools such as Prometheus, Grafana, and Alert Manager.
- Log management tools like ElasticSearch, Fluentd, and Kibana.
A Final Note: Observe and Improve!
Continuous monitoring and observability let DevOps & SRE teams stay alert of any risks or issues that occur in the software development lifecycle. It provides visibility across the entire CI/CD pipeline and infrastructure, giving regular updates on the health of the sytem’s environment.
To manage system infrastructures, teams need an effective platform and set of tools to visualize the operational states and notify you when a failure occurs. These tools allow you to understand and monitor system behaviours for preventing system problems in advance.
While focusing on building and scaling the product right, DevOps teams can rely on BuildPiper – as an underlying DevSecOps Platform for gaining complete Observability & Monitoring!
With deeply-ingrained capabilities such as Managed Kubernetes, Managed Microservices, easily configurable CI/CD Pipelines, Security, Observability & Compliance – BuildPiper has emerged as the Most Powerful Microservices Delivery Platform, in the industry TODAY!!
To explore its other interesting features, schedule a demo today!

